
Download the House View PDF here.
1. Crypto Market Insights
Crypto volatility remained historically low in October despite more turbulence in traditional markets. Behind the headlines, both corporates and regulatory bodies are taking steps into the crypto space, and developers continue building to be ready after winter.
By Lukas Jelk
UK Gilt bond volatility exceeds bitcoin volatility for the first time ever (!)
The month of October started relatively unspectacularly for crypto with the asset class mostly trading sideways. The turbulences on the UK gilt market did not significantly affect prices. Even the US core CPI print released on October 13th (with a higher-than-expected 6.6%), signifying a four decades high in core inflation, only led to very short-lived higher volatility. In fact, bitcoin’s volatility has already trended downwards since the end of June. Since July, the price has moved in a tight range between USD 25,000 and USD 18,000, which means that the 90-day realised volatility has reached its lowest level since December 2020. Both the NASDAQ 100 and the S&P500 exhibited higher 30-day realised volatility than bitcoin. Even the UK Gilt bond volatility surpassed bitcoin vol this month – this is something that was completely unimaginable just a few months ago. Bitcoin closed the month up +5.1%
Technical picture unresolved while valuation metrics are positive
The technical picture for bitcoin and the crypto complex remain unresolved with bitcoin having been stuck in the 18k to 25k range for over four months. There are no obvious technical trigger points at the current levels, and with volatility hitting historical lows, a resolution of the trading range is possible in both directions. However, valuation metrics can give us an indication of the bigger picture, which is increasingly positive given the attractive on-chain metrics. The RHODL Ratio, Puell Multipe, and Realised Price signal historic undervaluation in BTC. Sentiment indicators also hint towards upside potential, the BTC Fear and Greed Index, for example, is currently at “extreme fear,” which indicates that investors are quite worried.
Crypto miners hurt by perfect storm
Despite the lower bitcoin price this year, the hash rate of the Bitcoin network has reached a new all-time high, pressuring mining profitability. The last such divergence between hash rate and price occurred in Q1 of 2020, followed by the bull market of 2020-2021. However, the hash rate is a lagging indicator since deploying new hardware in response to a bull market takes time. Miner liquidity is another unknown. Mining reserves hit a 12-year low at 1.91 mn BTC according to data from IntoTheBlock, which is an indication of continued miner selling pressure over the course of the year. Miners are facing headwinds from low crypto prices, an increase in electricity costs, and – in the case of bitcoin – the record high hash rate. Core Scientific, the world’s largest bitcoin miner, has warned that it will suspend payments, basically heading towards bankruptcy.
Institutional adoption continues apace
After last month’s announcement of NASDAQ offering crypto custody, the next big US player, BNY Mellon Corp, is now also open for crypto.
After receiving approval from New York’s financial regulator, the oldest bank in the US (with roughly 47 trillion in assets) can now begin to receive and to custody their clients’ crypto, i.e., Bitcoin and Ethereum.
Mastercard also recognised this business opportunity, and is launching its own service targeted at banks, offering trading and the holding of crypto, in order to make it easier for the banks to offer these services to their customers.
In other news, Brazil’s largest digital bank, Nubank, will launch its own crypto asset called Nucoin on the Ethereum blockchain, using Polygon’s scaling solution, in the first half of next year.
In Switzerland, the Swiss Digital Exchange also finally announced the launch of their institutional custody services. Crypto custody offerings are a first step for many financial institutions into the crypto space, and competition is quickly increasing.
Winter is for building
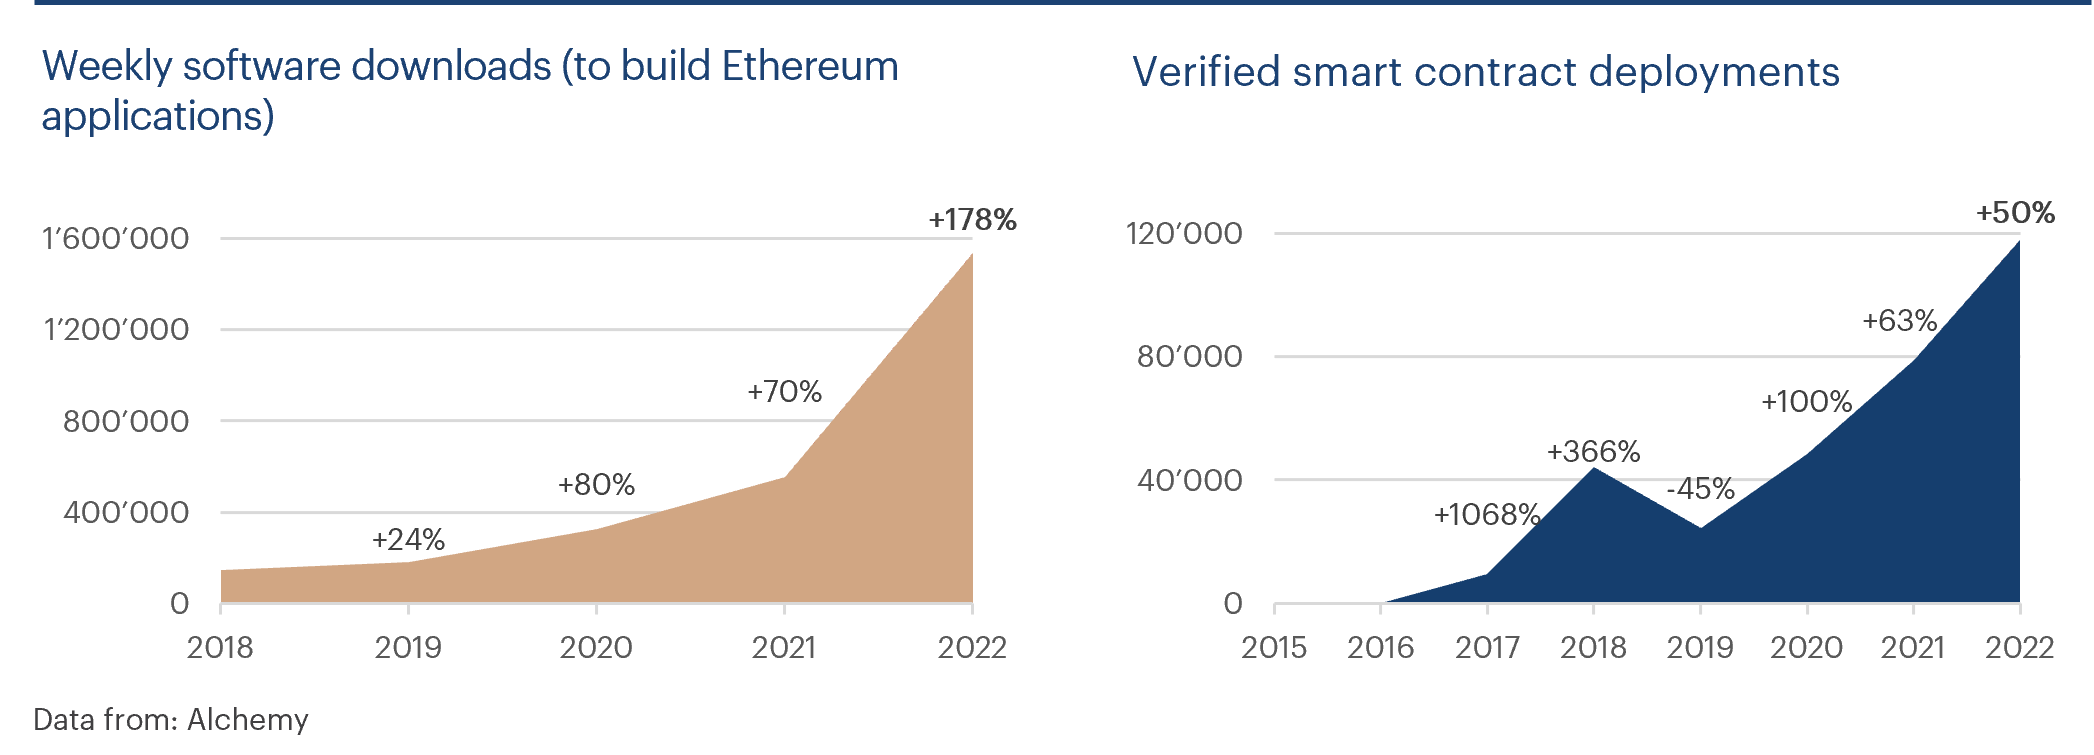
Despite the lower prices, developers continue building in record numbers. According to a report from the Web 3 platform Alchemy, download numbers of software needed to create smart contracts on Ethereum tripled in Q3 2022 compared to 2021, and are now at 1.5 mn per week.
In addition to this, 36% of all smart contracts in existence were created in 2022. This is impressive, especially in comparison to the last crypto winter in 2018-2020, when smart contract activity decreased by 40%.
A new crypto hub emerging in Switzerland
Earlier this year, the city of Lugano launched a joint initiative called “Lugano’s Plan ₿” together with the stablecoin platform Tether. The goal is to leverage bitcoin’s technology to transform the city’s financial infrastructure and attract startups to the region. It is already now possible to pay with bitcoin, USDT, and LVGA at a dozen locations in Lugano, the most prominent venue being McDonald’s. The joint initiative will create a CHF 100 mn investment pool for crypto startups and a CHF 3 mn pool to help local businesses with crypto adoption across the city. Applications will be accepted soon.
For the time being, the highlight of the initiative has been the Plan ₿ Forum, which took place at the end of October, gathering world leaders, technologists, and entrepreneurs to talk about bitcoin adoption.
Europe on track for digital asset regulation
The Markets in Crypto Assets Regulation bill (MiCA) was approved by EU lawmakers in October, passing another milestone and being just one final vote away from making it official law.
This means that Europe will have a single comprehensive framework for digital assets for all its member states by 2024. MiCA will regulate the distribution, issuance, and trading of digital assets, aligned with the MiFID regime to achieve uniform treatment. The framework is a massive improvement for the competitiveness of the EU member states in the crypto sector.
SEC vs. crypto
Across the pond, the SEC continues enforcing their hard stance against crypto. A spot bitcoin ETF by WisdomTree was rejected a second time after its rejection in December 2021. The SEC ruled that the trust could not demonstrate that it was “designed to prevent fraudulent and manipulative acts and practices”. Meanwhile, Grayscale filed an opening legal brief challenging a SEC decision made earlier this year to deny the conversion of its Grayscale Trust (GBTC) into a Spot Bitcoin ETF.
The SEC also opened a probe into Yuga Labs, the Bored Ape creators, and other NFT projects, investigating if they might be securities. After last month’s comment from SEC’s Garry Gensler stating that Ethereum could potentially be a security due to its staking rewards, the latest probe further demonstrates the risk for a wide range of crypto projects in the US being in violation of securities laws.
Tether claims no more commercial papers in their stablecoin reserves
Tether, the largest stablecoin by market volume, has long been considered a structural risk for crypto as questions to the quality of collateral have been raised for years and never been adequately addressed. Recently, Tether announced that it has eliminated commercial paper from its reserves, replacing these investments with US Treasury Bills. While Tether still has not undergone an audit to prove this claim, it at least appears to have taken steps to improve the quality of collateral and oversight, after having chosen BDO Italia for their attestations this year. It is a positive step towards more transparency but still leaves a great deal to be desired. Tether is possibly preparing for stricter stablecoin regulation, which is to be expected in both the US and in the EU.
Outlook
While the markets remained calm in terms of price action, we are seeing many positive developments for the asset class happening in the background on both corporate and regulatory levels. The number of developers and new smart contracts launched this year alone is also encouraging, and signals growth of the ecosystems. These developments should support the adoption and maturing of crypto over a longer-term perspective, and once a “tipping point” is reached, it could lead to much higher valuations.
For the short-term it remains to be seen for how long the low volatility regime in crypto will continue, and when volatility will pick up again, in which direction the price will go. One likely trigger for a breakout is a shift in the USD, which is not necessarily dependent on the – elusive – FED pivot that the market has been hoping for. Against most metrics, the USD is massively overvalued and also appears to be a very crowded trade. Historically, bitcoin did well when the USD weakened and vice versa. Upcoming macro–factors, e.g., inflation and rate hikes could also dictate the direction of the next big move.
Another catalyst in the market could be Ethereum’s 2023 upgrades. First, unstaking should be enabled, which completes the transition to proof-of-stake. Later in 2023, Ethereum aims to introduce sharding, which will increase scalability and reduce fees. A faster and cheaper Ethereum network could re-energise the blockchain momentum. Combine this with the reduced ETH supply issuance since the merge this year and the upcoming bitcoin halving, also reducing BTC issuance in early 2024, there are several factors that support a major move upward once demand returns.
In closing, we would like to reiterate the view we voiced a few months ago: it is likely that we have put in a bottom around the June lows.

2. Where are we in the Crypto Cycle?
There are numerous indicators we can monitor and analyse for guidance
By Can-Luca Koymen
Introduction
Despite crypto being a young asset class, there is a great deal of indicators, data, and metrics that can help us understand the relative attractiveness of crypto at any point in time. Not surprisingly, the best and deepest data is available for bitcoin.
In this article, we will share which indicator categories we monitor on an ongoing basis to get a feel for where bitcoin – as a proxy for the overall crypto market – is in the market cycle. We have broken the data set into seven distinct categories and will explain what information is being analysed in each data bucket.
On-chain data
On-chain data derives various insights by aggregating all publicly available information from transactions recorded on the BTC blockchain. The transparent nature of blockchain technology allows for powerful market insights that are unheard of in legacy finance.
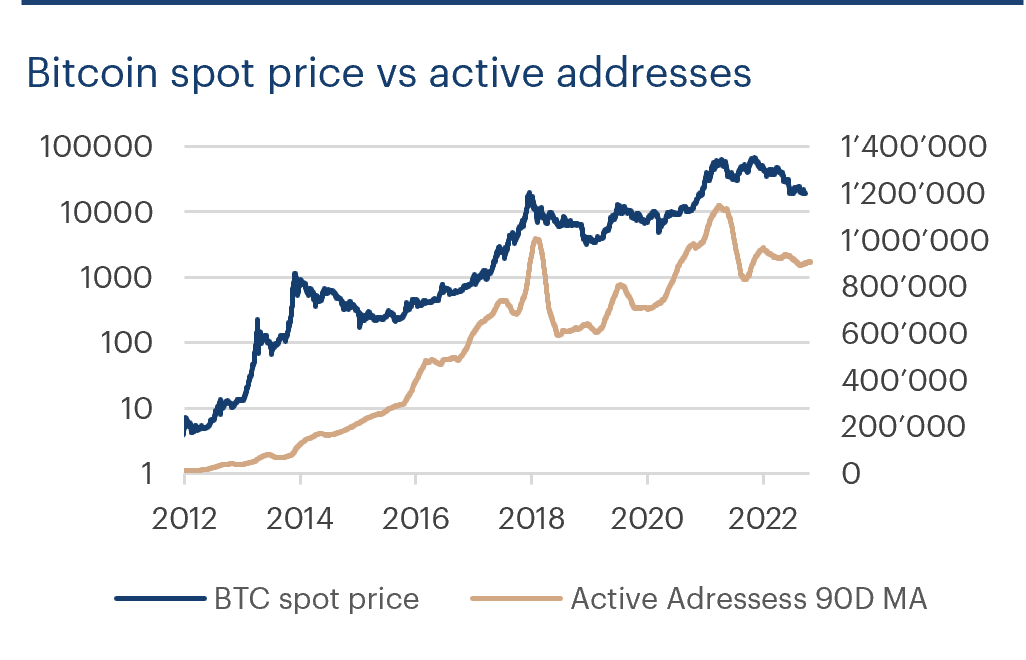
Example: Active addresses growth
The evolution in number and size of wallets allows us to quantify the speed of adoption and where we stand in the current market cycle. The chart below, for example, plots how the number of active BTC wallet addresses follows an independent uptrend in the long term while a stronger co-movement with the price is evident in the short term.
Fundamentals and Valuation
Fundamental valuation tools in crypto are created through combining on-chain data with price information. This enables the creation of metrics designed to quantify whether BTC is currently undervalued or overvalued relative to measures such as on-chain activity, miner profitability, etc.
Example: Puell Multiple
The chart below plots the log BTC price versus the Puell Multiple. The Puell Multiple examines the fundamentals of mining profitability and how they shape market cycles. Lower values indicate that miner profitability is relatively low and that miners may consider reducing hash power, which reduces selling pressure on liquid supply. A low reading typically points towards a good buying opportunity and coincides with market bottoms.

Macro view
Developments in macroeconomics are crucial in forming a big picture view on the current BTC cycle. Systematically monitoring and understanding macro factors help to quantify whether the current macroeconomic environment is favourable for a bullish BTC cycle phase or not.
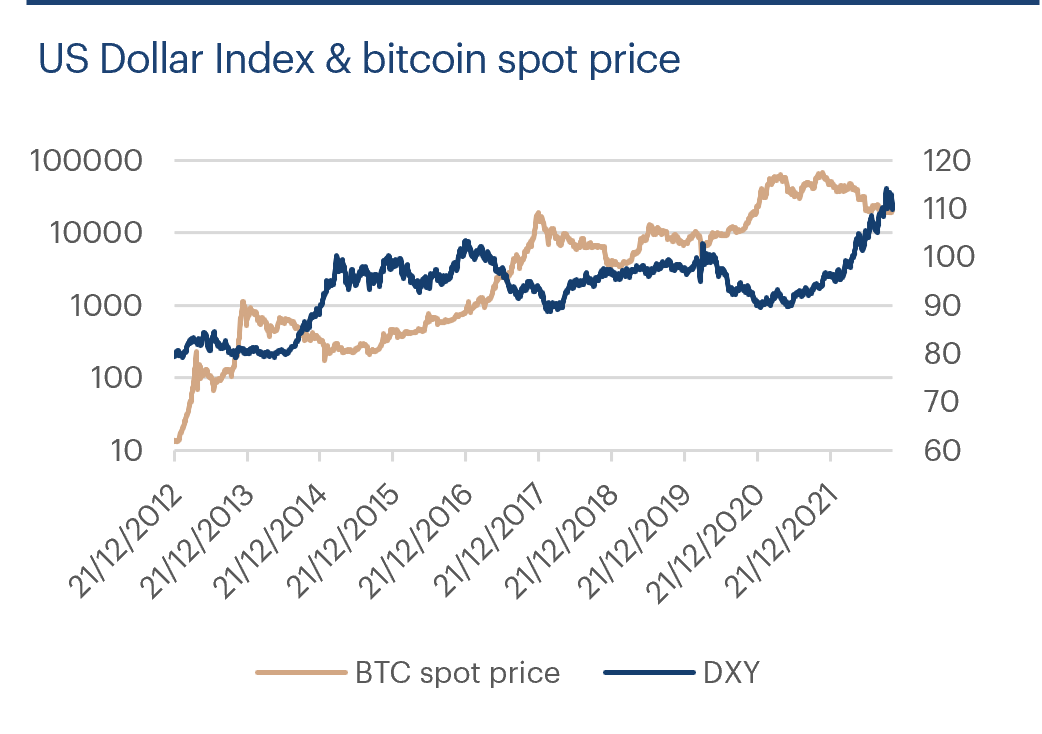
Example: US Dollar Index
In the chart below the US Dollar Index (or so-called DXY) is plotted against the BTC spot price. The DXY measures the value of the US dollar relative to a basket of other currencies.
An inverted relationship seems to exist. BTC performance is especially strong in times where the DXY is lower. The last two BTC cycle tops in 2018 and 2021 coincided with a temporary bottom reading of the DXY. Vice versa, the BTC price correction from the last top at USD 69k coincided with a strong positive rally of the DXY. Multiple reasons for this inverted relationship exist.
A simple and technical explanation is that BTC is still mostly traded against USD instead of other FIAT currencies. This means that BTC investors with a non-USD base get less USD to invest in BTC in times of a strong dollar, which results in reduced buying pressure. Another more fundamental angle to explain this relationship is from a supply perspective. A weaker dollar due to an increasing money supply makes assets with a fixed limited supply more attractive. Consequently, in periods where central banks are predominantly dovish, the argument for BTC’s unique properties, such as a fixed final supply and a decreasing inflation rate, appear even more compelling. By quantitatively analysing trends in the DXY we can obtain an objective view as to whether the USD environment currently is favourable or not for the BTC price.
Technicals
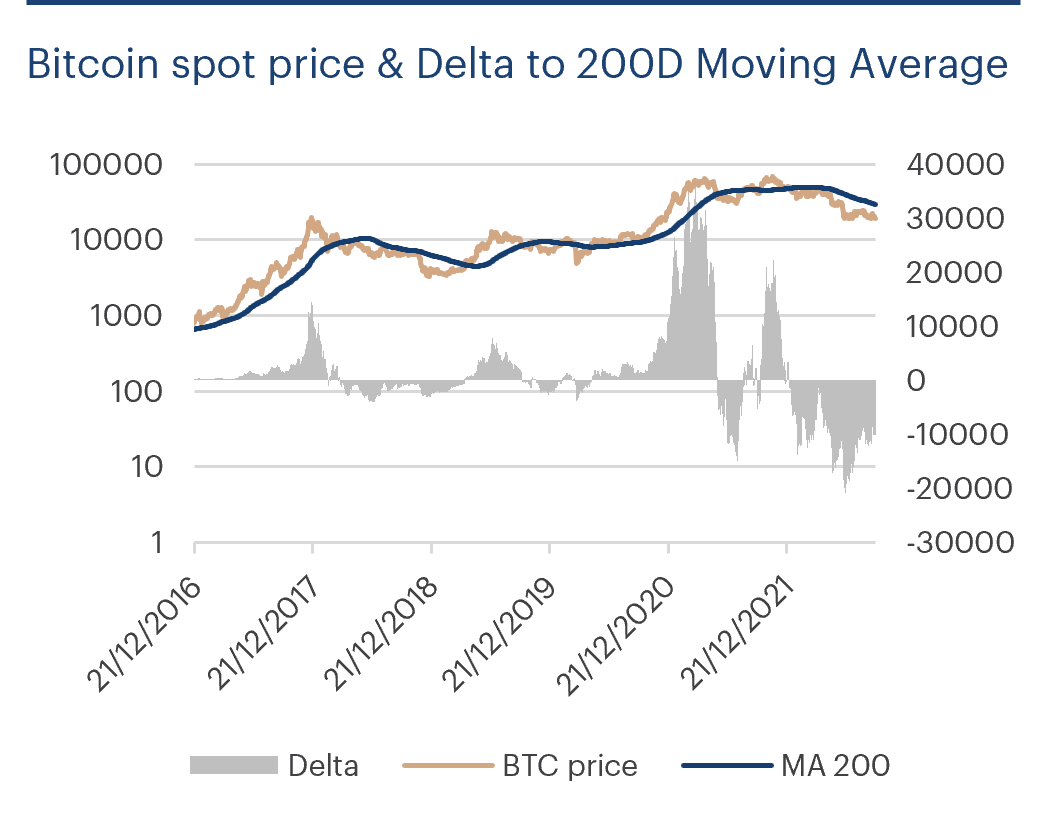
Technical analysis includes classic indicators and metrics known from legacy finance, but also entail new variations. Chart patterns are not considered. The chart below shows that very simple studies, e.g., moving averages, can already be very powerful in signaling attractive buying windows.
Web sentiment
Web sentiment leverages data sources, such as Google searches for key words related to crypto. An example could be “How can I buy bitcoin?” or “What is bitcoin?”. Growth trends in search behaviour for such key word combinations can signal whether the speed of crypto adoption is likely to accelerate or not.
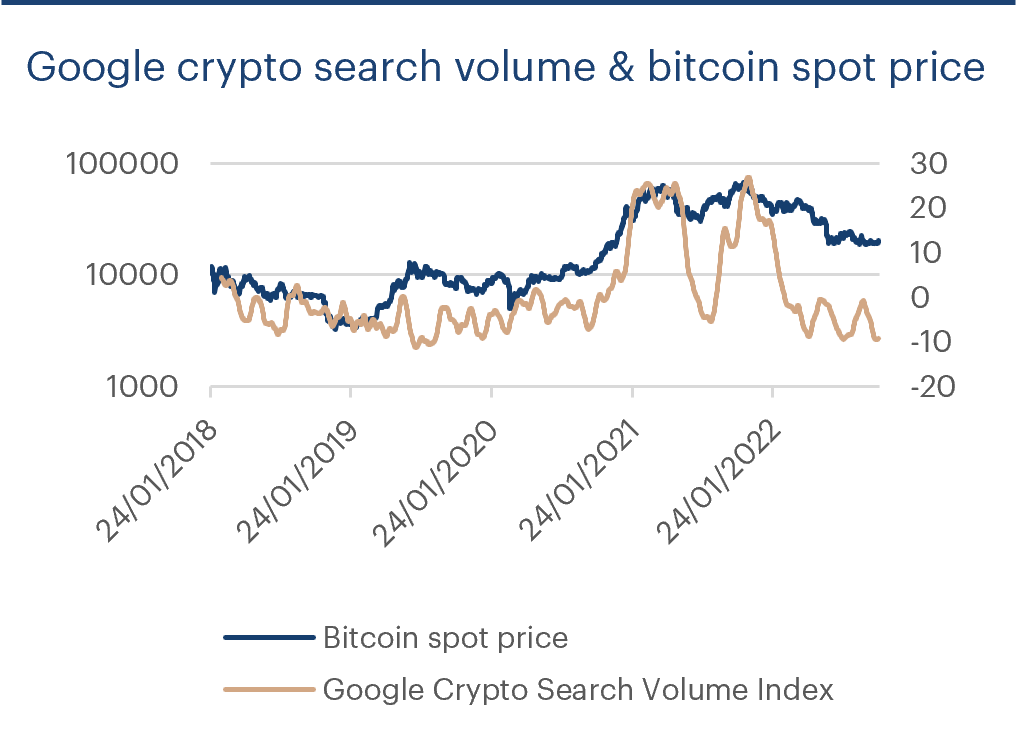
Example: Google search volume
The chart below plots an aggregated index of positive and negative key word Google search volumes against the BTC price. A correlation is observable, and this makes sense as increasing positive search volumes can be interpreted as a proxy for potential new interest for adoption. Vice versa, BTC price corrections coincide with periods of predominantly negative aggregated sentiment.
Market positioning
Market positioning data can give insights into the true and objective state of BTC investor portfolios. A great deal of information about current positioning is available.
The transparent nature of blockchain technology allows for powerful market insights that are unheard of in legacy finance. We can even derive an estimate as to how many wallets – and in extension positions – are in a profit at the current market price.
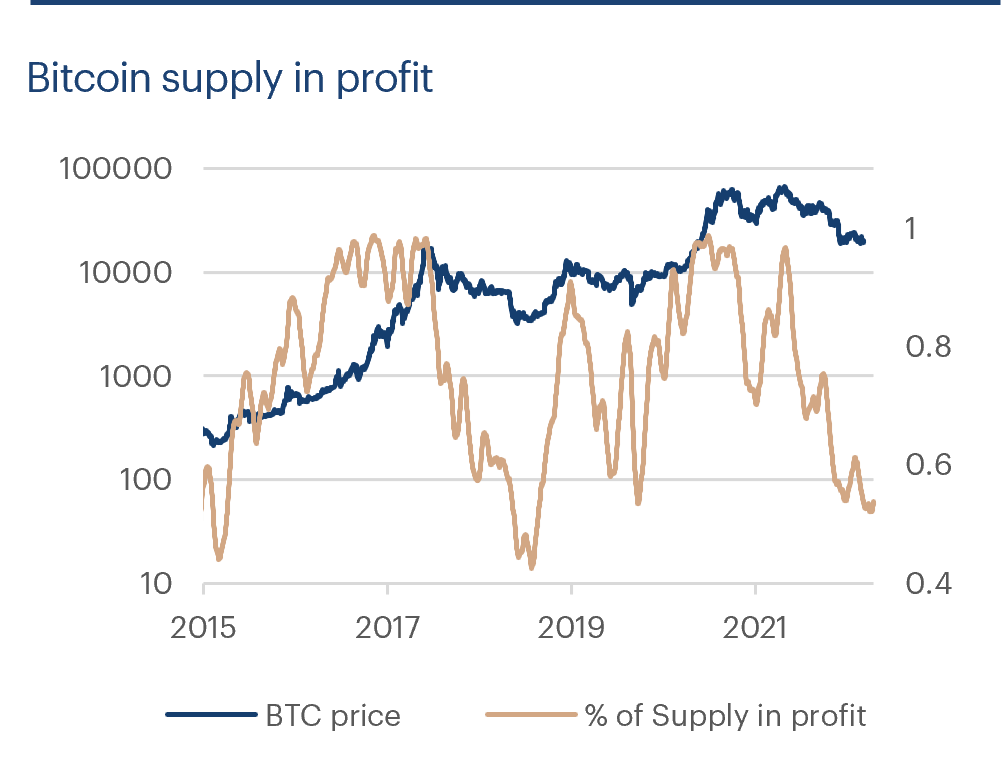
Example: Supply in profit
Supply in profit is the percentage of existing coins, the price of which was lower than the current price the last time they moved. Even though this metric is only an estimate by incorporating on-chain data, it is very powerful. Time frames where most of the circulating BTC supply is in profit coincide with market tops, and the opposite holds true when less than 50% of the circulating supply is in profit.
This relationship especially makes sense for tops. If a comparable metric could be calculated in legacy finance one would expect a similar relationship, but only blockchain technology offers such unique insights.
Stability
Healthy stablecoin markets are key for crypto. This was underlined in the Terra-Luna meltdown. Observing and quantifying stablecoin markets offer ways to measure the health and stability of crypto markets in both the short and long term. Additionally, dynamics within stablecoin market flows give clues as to how aggressively investors are accumulating or decumulating BTC or other crypto assets.
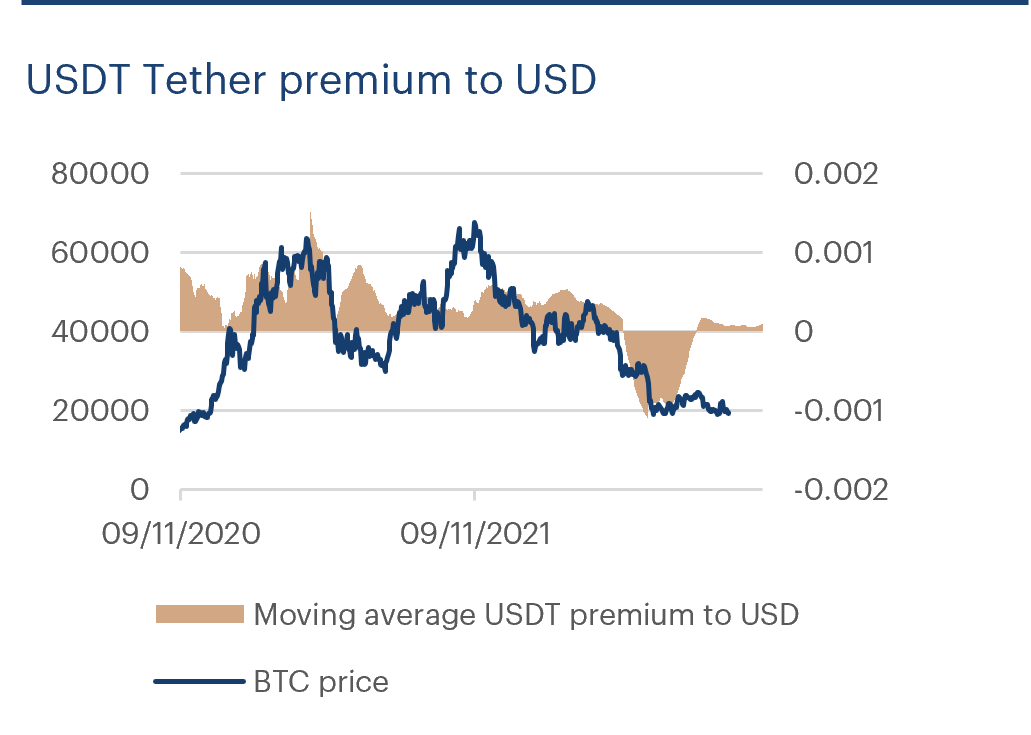
Example: USDT Tether premium to USD
In the chart below, the premium of the Tether stablecoin versus FIAT USD is plotted against BTC. A positive premium can indicate that investors are buying USDT with USD to invest in BTC or other crypto assets and vice versa.
In bullish time frames, the premium tends to be positive and vice versa for bearish months. Understanding and measuring trends in stablecoin pegs can deliver very powerful insights.
3. Bitcoin Mining Developments
Bitcoin mining business intensifies – but becomes more sustainable in the process
By Dr. Lewin Boehnke
In 2022, numerous eyebrow-raising developments came out of the bitcoin mining industry. It all started in February with the increased media attention on the first industrialised application of “flare mining”.
The advent of flare mining
A certain amount of natural gas is an unavoidable by-product of the exploitation of oil fields. The oil is transported off but building a pipeline for the gas is not economically viable in most cases. Simply releasing it into the atmosphere would be the worst option. As far as greenhouses gases go, methane is about 80 times more aggressive than CO2. It is therefore common practice to burn the methane on-site, which still only amounts to being 75% to 90% effective. The CO2 from global flaring emissions is roughly comparable to the greenhouse gas emissions of Egypt.
Tech start-up Giga has successfully deployed gas generators and bitcoin mining hardware at such a site, turning the methane into electricity and the electricity into bitcoin. Generators, of course, aim to extract the maximum energy content from the methane. The conversion rate of methane into CO2 is significantly higher than simple flaring. In effect, with bitcoin mining, the CO2 equivalent of the greenhouse gases emitted from the oil site is about 60% lower than before the gas began being diverted to bitcoin mining.
Flaring on oil fields has been around for 160 years. Mining is not crowding out other uses of that energy source, as it is economically stranded pockets of energy that are being used.
The decay of the organic parts of waste in landfills also produces (mostly) methane. For many landfills, using that methane to produce electricity to feed into the local grid or to use it for other purposes is a viable option. This is currently the case for roughly a quarter of all landfills in the US. In more than a third, the methane is not even flared, but simply released into the atmosphere. The company Vespene Energy recently announced a pilot site in central California that will see similar reductions in CO2 equivalent emissions as the oil flare gas mining sites already exhibit.
It would be a stretch to argue that this salvaged electricity is from “renewable” sources, but as it is obviously net positive for the environment. Statistics that focus solely on the energy mix of bitcoin mining fail to capture the full picture, and mining with otherwise wasted energy is net neutral at worst.
These examples are anecdotal. There are no reliable numbers for the ratio of the total hashrate that is mined in such a non-competing way. There can’t be reliable numbers for that. Mining is non-permissioned. Miners don’t register to participate, and hardware can enter and exit the network without notice.
The cheapest energy sources are unused ones
What is remarkable about the examples above is that the use of these alternative sources of energy is not driven by a necessity to follow ESG requirements or any kind of regulation. It is being done out of purely egoistic and economic considerations. The cheapest energy source is a dormant energy source. Any competition for that energy would put a floor price on it.
Bitcoin mining has very specific energy needs. What is required for a striving mining operation is cheap electricity and not too high temperatures. An internet connection is necessary only for a few hundred bytes every minute or so. That is about one percent of a typical website cover picture. Any slow satellite uplink will do in remote locations. While the CapEx of the hardware does not justify being powered, e.g., by solar panels, and would therefore only be operational half of the time, being in a symbiotic relation with power producers or other consumers can lead to surprising results. E.g., an electricity grid that is dimensioned to serve in case of hot summer days (with a great need for air conditioning) means that electricity production must be able to be added quickly. This will most likely be nuclear, coal, or gas. Or it can be made from renewable energy sources and be significantly overprovisioned most of the time. Mining can change the economic considerations in terms of which of the two options is chosen. As it can be switched off during those few days a year. Power producers have discovered this benefit and now frequently refer to this as intermittent mining.
In 2022, this famously became bitcoin mining news, when mining operations in Texas were able to completely shut off their operations on short notice after the grid operator ERCOT created financial incentives to do so in an attempt curb the impact of the extreme heat in July.
Durable turnkey standard-sized containers start from 300kW, which is roughly the continuous energy consumption of a bus used for public transport. Excess energy of that magnitude is not typically worth the effort to exploit for other energy-intensive industries that require, e.g., workers to be present. Infrastructure is necessary only to a degree that it allows the transport of the containers to their destination, and transporting them off within a few months, if the excess energy dries up.
Bitcoin’s mining industry is currently not competitive enough to be working on such excess energy sources alone. Mining hardware, if cheaply sourced, is profitable to operate in regions with low electricity prices in ways that are purely conventional. This is likely to change over the coming years. Every halving reduces the “subsidy” that currently fuels higher electricity expenditure than the security demand of the network. Lower price volatility drives lower margin mining operators. And mining hardware production has finally caught up with the state-of-the-art chip production, leading to a substantially slower obsolescence of devices and higher availability. This has rendered OpEx more important than CapEx.
Outlook
The days of students mining in dormitories with an electricity flat rate included in their rent are long gone. And mining in datacenters will disappear next. They are being priced out by mining enterprises that are operated by power grid experts instead of cryptocurrency enthusiasts. Market mechanisms will drive mining towards dormant energy sources. And this means that it will automatically become more sustainable.
4. Trading Desk View
October was positive for some altcoin sectors, showing renewed risk-on appetite
By David Scheuermann
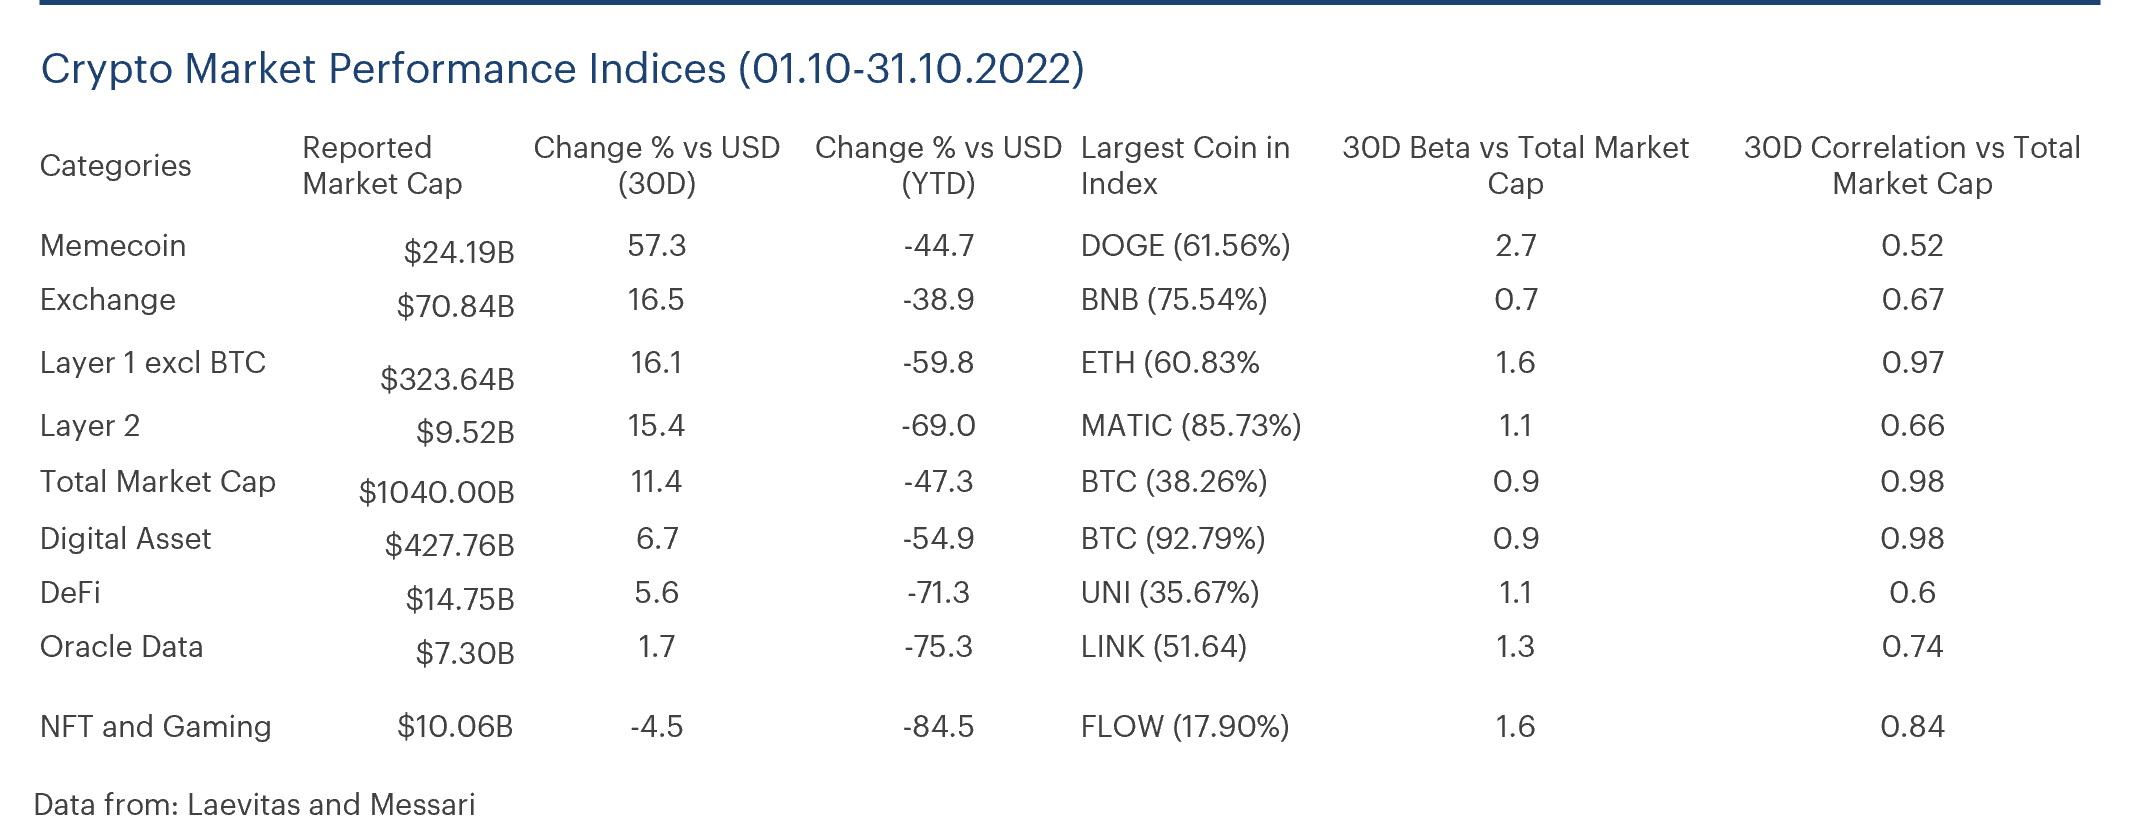
Layer 2s, off-chain solutions to reduce bottlenecks with scaling and data, were among the best performers last month. There is currently a great deal of attention on scalability efforts, as this is being viewed as an integral part of the Ethereum network post-merge. Polygon (MATIC) is currently dominating the Layer 2 space. Its low correlation to the total market shows that projects actively being adopted can deviate from the rest of the market, and significantly outperform. Polygon recently announced another high caliber partnership with Brazilian fintech bank Nubank for the creation of a planned Nucoin token.
The DeFi sector is one of the more surprising outperformers. The Maker protocol allows users to lock up collateral and take out loans in DAI, a decentralised stablecoin that aims to have a 1:1 value against the USD. MKR, its governance token, is up 21% on the month and is the 3rd largest constituent of the Laevitas DeFi Index. The increase in price came after the DAO announced it would invest $500mn of its funds currently used to collateralise the DAI stablecoin into US Treasury bonds and corporate bonds for diversification.
The NFT and gaming index continues to be the worst performer this month. Axie Infinity (AXS), the 6th largest constituent of the NFT Gaming Index, dropped about 29% this month and traded at a beta of 1.47 in relation to the total market. The sell-off was likely due to the anticipated 8.1% unlock of total supply as vesting periods expired.
Most Layer 1s (base blockchain networks such as bitcoin) continued to underperform ETH this month. Cardano (ADA) and Solana (SOL) are the 3rd and 4th largest Layer 1s by market cap and lost 8% and 1% respectively. Cardano has so far failed to amass project development, even though smart contracts were deployed on the blockchain last September. Solana, however, experienced yet another major outage at the beginning of October, and its native decentralised exchange Mango Markets experienced an exploit mid-October. TVL (total-value-locked) of Cardano and Solana shrunk by 8% and 27% last month, while Ethereum’s increased by 4%. Due to the lack of innovation and adoption, ADA and SOL have yet to find their own lane in this bear market and therefore have a high correlation of 0.86 and 0.87 to the total market.
The memecoin sector saw a sudden sharp spike at the end of the month. Dogecoin (DOGE) and Shiba Inu (SHIB), among other dog-coins, rose after Elon Musk completed the acquisition of Twitter. Investors are hopeful that DOGE will be integrated into the social media platform as a payment method.
5. Deep Dive: Volatility
Crypto has been extremely volatile in the past. Now everything is different with crypto volatility lower than equities. While volatility will pick up again, a growing and maturing crypto space may dampen the future rise in volatility.
By Matteo Bottacini
Crypto volatility has historically been high, a multiple of that of equities. This fact is often cited as a barrier to entry by some traditional investors.
This year has so far been the worst year in terms of portfolios’ absolute performance across asset classes, characterised by a high volatility regime and high correlations between different asset classes. Throughout 2022, investors were basically left in the traditional space with nowhere to hide. So far crypto has been surprisingly less volatile than in previous years, and currently with bitcoin trading at 26.5% realised volatility over a 30-day window, bitcoin is even less volatile than equities.
Reasons for the low volatility in crypto
Leverage in crypto was one of the key drivers for the astonishing performances in the past, but also resulted in sky-high volatility. In May-June 2022 many investors became forced sellers after the Luna, Celsius, and 3AC collapse, and a vicious cascade of liquidations unfolded, which led to one of the greatest deleveraging events in crypto history. We believe these events helped the market’s long-term growth, as they made everyone more aware of the risks. The lower leverage in the system reduced volatility this year.
Volatility is cyclical and it is highly dependent on the maturity of the market, which means that assets with smaller market capitalisation, less liquidity, and fewer financial instruments (i.e., Futures, Options, CDS, etc.) tend to trade at higher volatility.
To some extent, they are less efficient than more mature markets, and price discovery takes longer. The alpha crypto delivered in the past may have been the combined results of liquidity, leverage, and small cap premia.
We believe volatility in crypto will pick up again from currently extremely compressed levels, and we expect it to trade in a 40-60% range in the long-term, closer to the volatility of small cap equities.

The role of gamma exposure
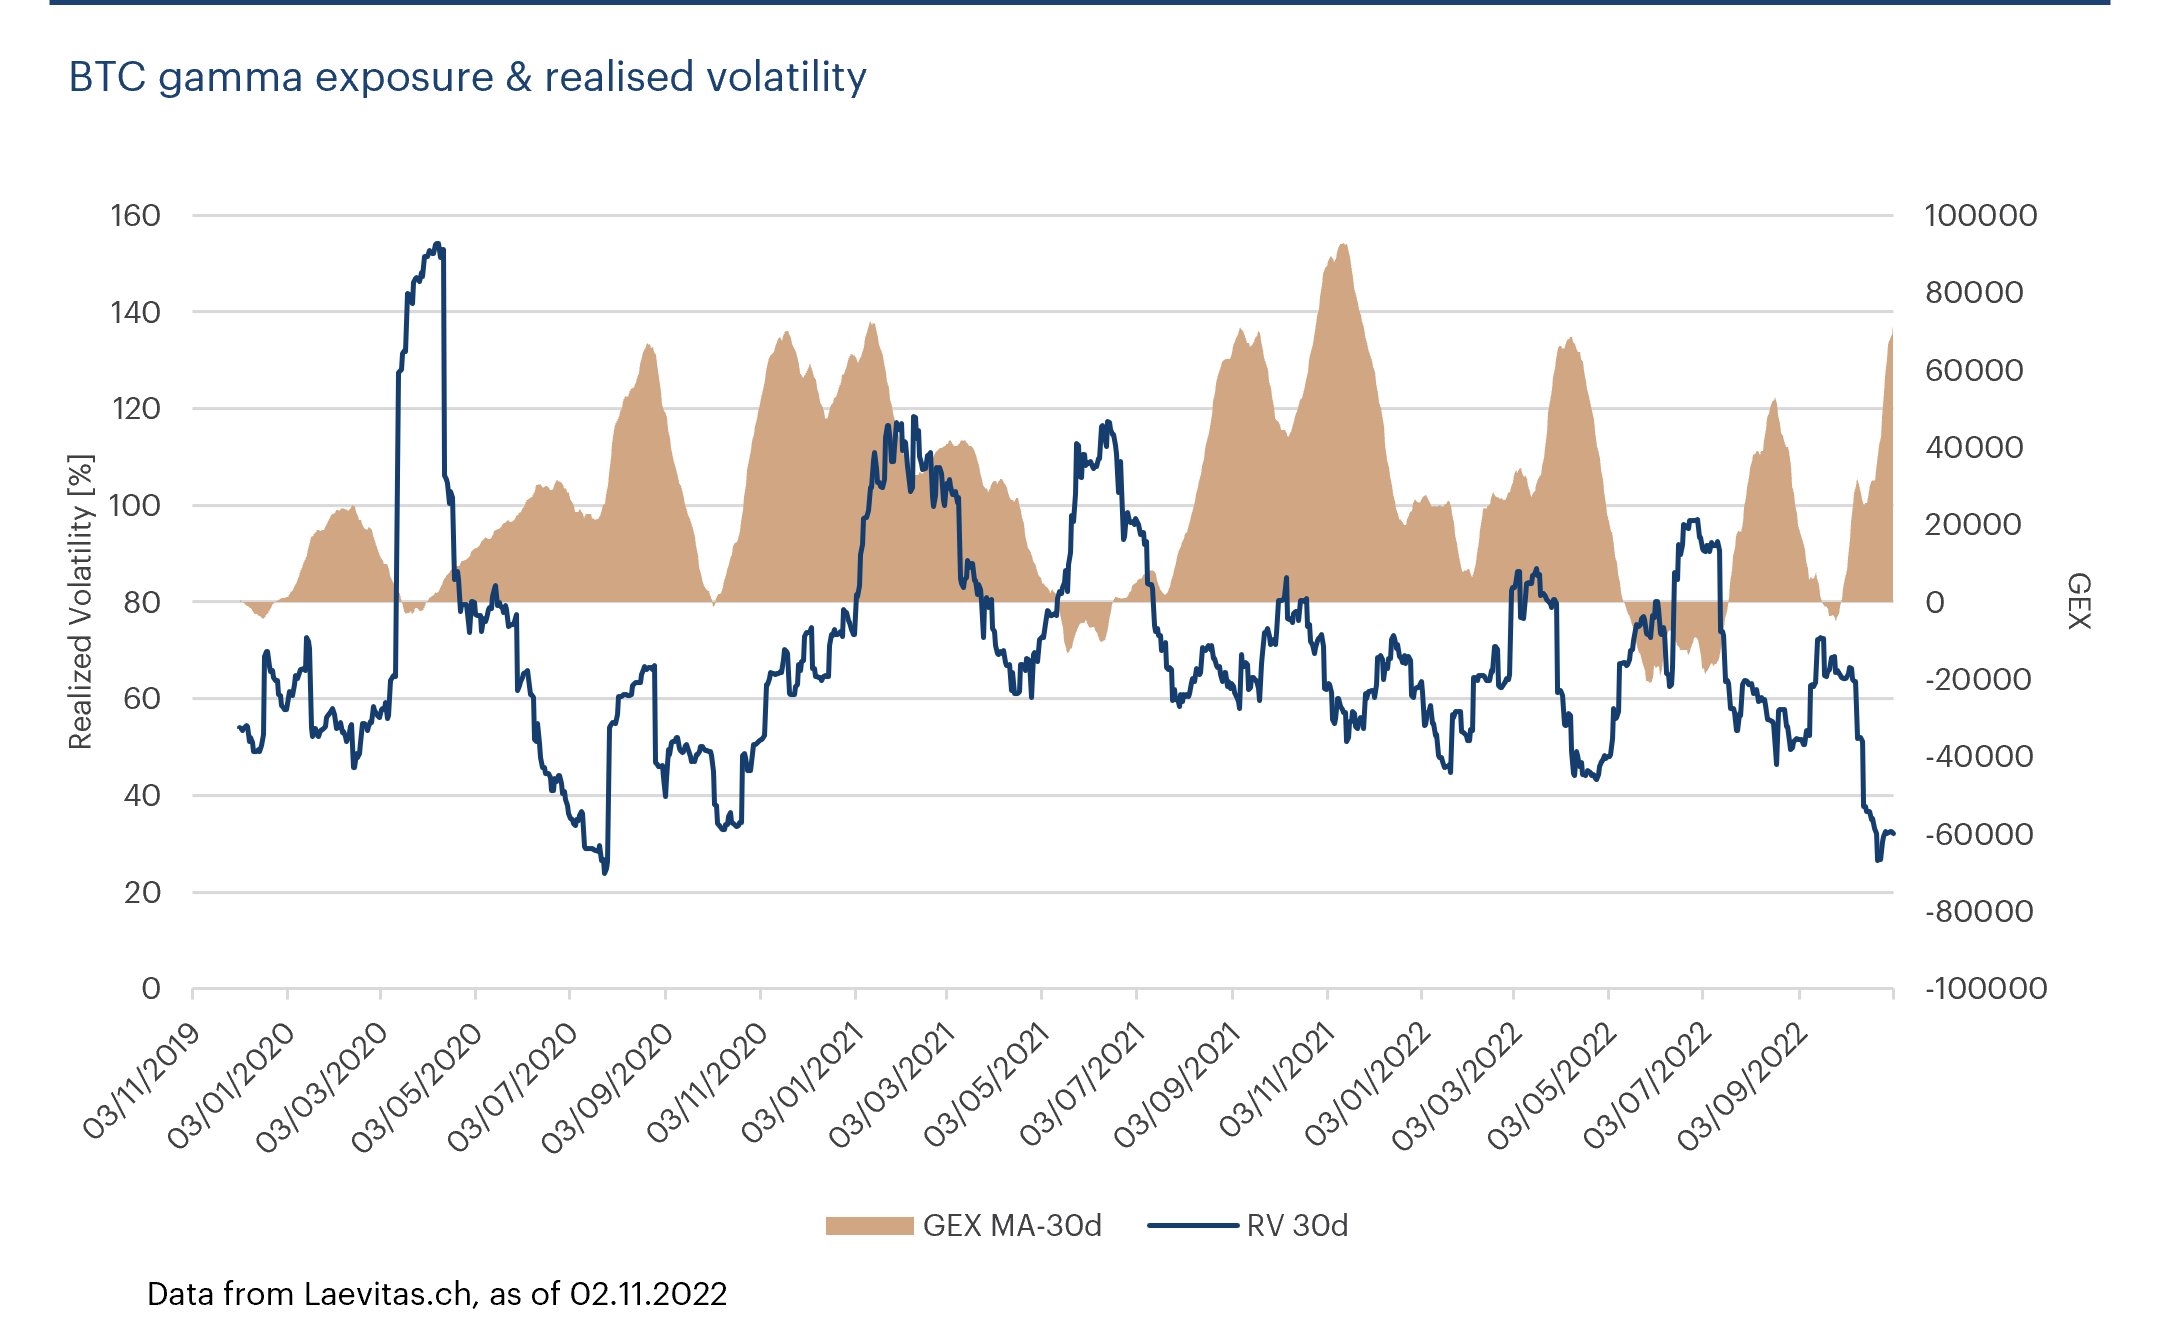
More professional participants have joined crypto in the last couple of years, and the derivatives space has developed a great deal, reducing volatility. Systematic funds have been selling volatility and trading gamma professionally. We find empirical evidence of this in the chart below showing BTC 30-day realised volatility and the Gamma Exposure (GEX) of BTC. The GEX relates to the sensitivity of option contracts to changes in the underlying price.
As options market makers tend to be delta neutral, they act as a catalyst for volatility. The greater the overall gamma exposure by market makers is the more the volatility is compressed. Similarly, the lower the GEX, the higher the volatility. From the chart we can see that peaks in volatility were in periods of low and/or decreasing gamma values. Similarly, when gamma is high, and continues staying high, volatility decreases.
At the current situation, with gamma at these levels, we do not expect a persistent rise in volatility any time soon.
Correlations to tech equities to diminish
As an asset class, bitcoin and crypto have turned into tech high-beta macro risk assets this year, with significant volumes around macro-headlines, and moving in-line with tech stocks. But this was not always the case. In 2021, the correlation between crypto and tech equities was close to 0.
Correlation between assets is not bad per se. It is used to check for linear relationships or interdependences between two variables, while co-integration is used to check for the existence of a long-run relationship between two or more variables. As long as crypto is not co-integrated with traditional assets, there is no mean-reverting process between the two, but rather there is an alpha to capture. We do not expect crypto to be co-integrated with equities any time soon.

