- BTCUSD: 25,771, -7.28%
- ETHUSD: 1,814, -4.43%
- US02Y: 4.49%, -3 bps
- DXY: 103.83, -0.45%
- GOLD (USD/OZ): 1,960, +1%
- NDX: 14,556, +1%
- VIX: 14.72, -17.95% (!)
- VVIX: 85.77, -12%
On the macro side:
This week, there are no major macro figures to watch, which is generally a good sign. So, let us dive into two key topics: the debt ceiling and the job market.
The debt ceiling:
President Biden’s signing of the debt limit deal has finally put an end to the ongoing saga, but it has raised concerns about one of the market’s best friends: liquidity.
The US Treasury will soon issue a significant number of bonds to replenish funds, which will impact liquidity through bank deposits.
JPMorgan predicts a $1.1 trillion decrease in overall liquidity, potentially leading to a 5% decline in stock and bond performance.
According to BofA, this could have a similar economic impact as a 25 bps interest rate hike.
However, in my opinion, the resolution of the debt ceiling will likely result in increased spending. This can be negative for debt holders (bondholders), but positive for equity holders (stocks and risk assets, e.g. cryptocurrencies). The trickier part is understanding whether this will result in excessive inflationary pressure or something akin to QE.
Overall, I believe this situation is bullish for digital assets, as at some point, this new cash will reach crypto, for sure.
The US job market:
Last week’s job reports presented a mixed picture. The US job market surpassed expectations by adding 339k jobs, marking the highest figure in four months. However, the total number of jobs gained in 2023 has exceeded 1.5 million, which goes against the goals set by the Fed.
Unemployment rose from 3.5% to 3.7%, and wage growth slowed, with average hourly earnings increasing by 0.3% in May and 4.3% annually.
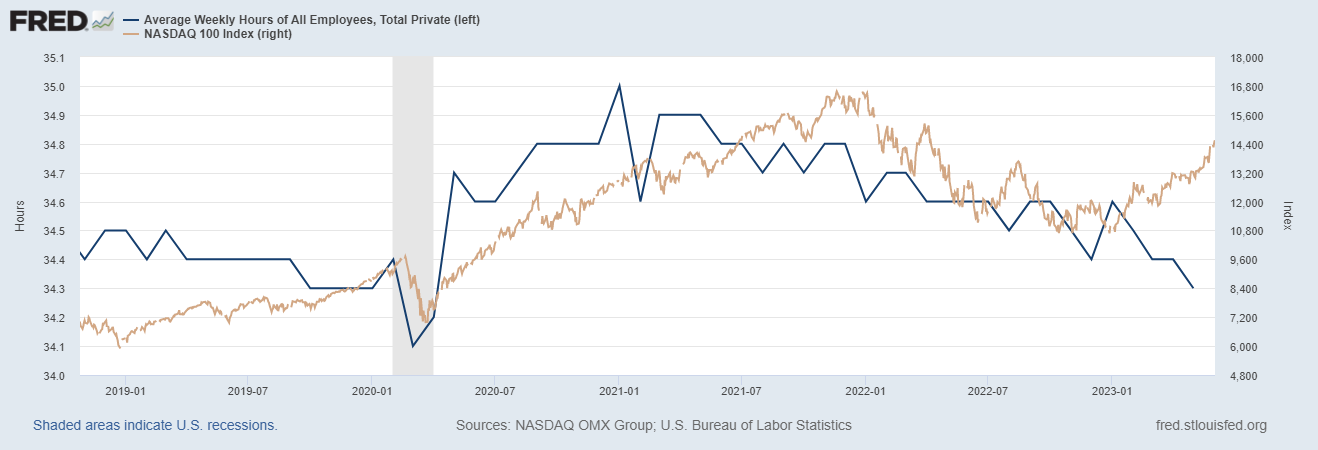
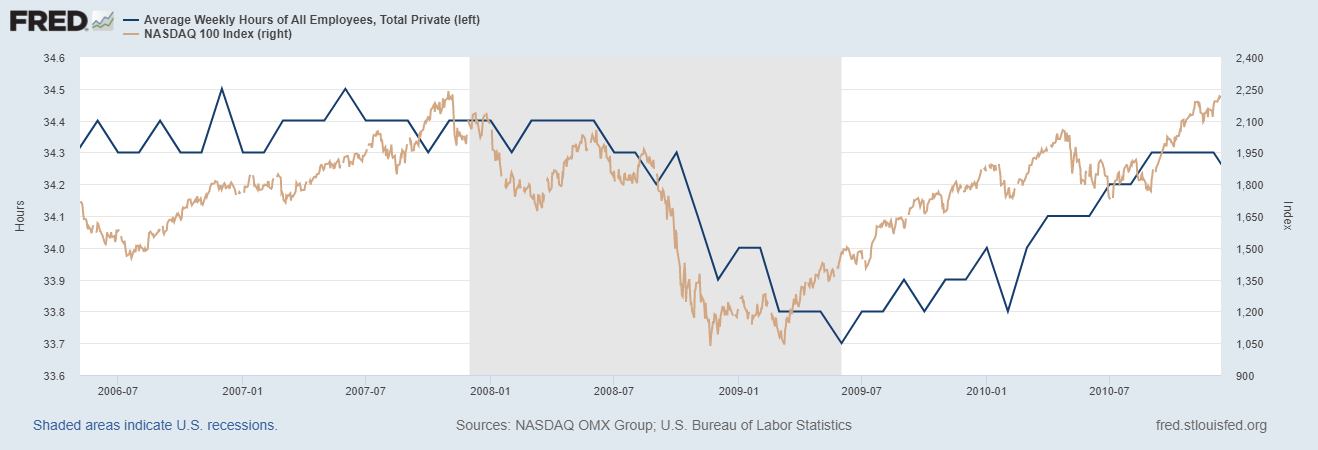
Additionally, US average weekly hours showed a downward trend, coming in at 34.3. A reduction in working hours by employers often precedes layoffs and serves as a warning sign of economic recession and market downturns. We witnessed a similar pattern during the 2008 financial crisis, where the Nasdaq 100 and working hours moved in sync. Currently, the gap between these two indicators is widening: a new regime or an upcoming mean-reversion?


Chart 1 & 2: Average Weekly Hours of All Employees, Total Private (left) and Nasdaq 100 (right), 2008 vs Now.
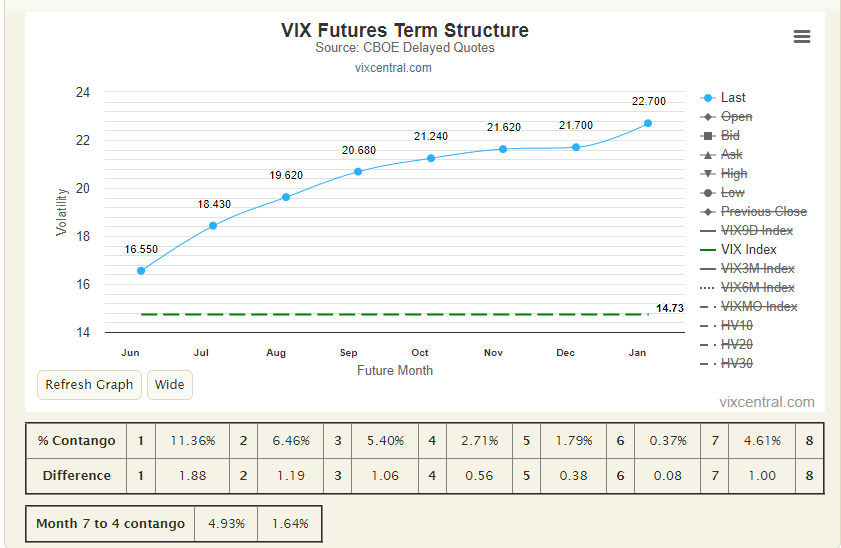
The stock market continues reacting positively, with the cash VIX reaching a three-year low, at levels last seen before the COVID-19 pandemic. VIX futures are in a steep contango, with the July contract trading at an 11.36% carry premium compared to June!
 Chart 3: VIX and VIX Futures Term-Structure
On the crypto side:
The market reaction to the news of the SEC suing Binance and CZ for violating US security regulations seems like an overreaction to me. The filing does not present anything new, except for the fact that it mentions bitcoin as a security but makes no mention of ether.
Personally, I have always considered bitcoin a commodity due to its inherent value appreciation, which is the primary benefit for investors, like gold & co. However, ether is more debatable, especially with its staking and the various services built on top of it.
These headlines, combined with low liquidity and difficulties in swift fiat transactions, have led to significant liquidations and price drops. In my opinion, this presents a favourable entry point for most cryptocurrencies, and it might be a good time to shift from being net-long on ether to being net-long on bitcoin.
As I mentioned last week (ref:TA Tuesday: Economic data and crypto prices await direction as market signals remain uncertain (crypto-finance.com)) , positive narratives are surrounding Ethereum and the altcoin space. However, with the recent drop in bitcoin (ETHBTC: +2.85% WoW), it seems like a favourable opportunity to take profits and adjust one’s position.
Nevertheless, I am still biased towards ETHBTC at 0.072, but starting to rotate makes sense.
On the derivatives side:
To a certain extent, crypto vol is mimicking equity-vol (think of VIX).
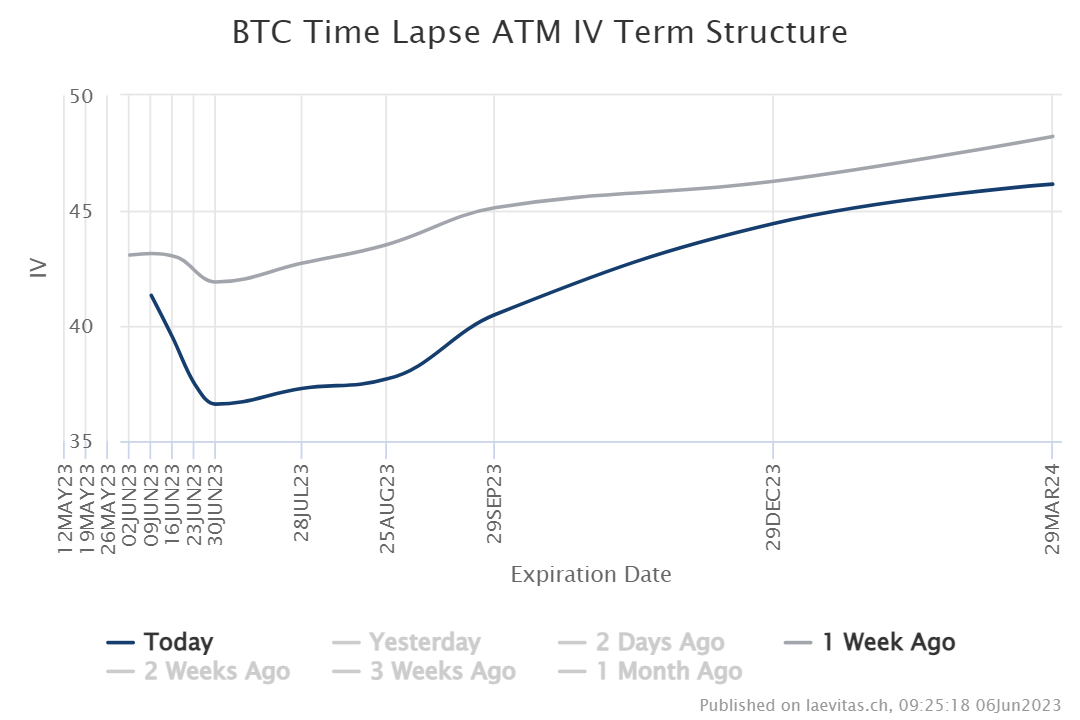
The term structure of BTC ATM implied volatility is still in a steep contango, with 180-day tenors trading at 7v premium to 30-day tenors, and not moving at all following yesterday’s announcements, as the BTC time lapse atm vol term structure shows.

Chart 4: BTC ATM Implied Volatility Term-Structure, today vs 1week ago – src: Laevitas.ch
Although I have historically favoured long theta positions, in the current market environment, I prefer keeping the book long vol in the front end of the curve and short in the back end of the curve, which over the last few weeks has been a profitable setup. A trade I keep liking here is put calendar spreads such as the long 30-day versus short 90-day spread, Given the current convexity, I am comfortable trading within a +/- 2.5% range.
Additionally, yesterday evening, the move looked like a short earthquake, and as with all earthquakes, there are always aftershocks. Short-term implied volatility can easily increase into the 60s.
On the skew side:
As the spot price dropped, the options market started favouring puts over calls, with the 25-delta 30-day risk reversal now trading at a 2v premium for puts. Reversals present an interesting opportunity, but it may still be early to fully capitalise on them.
Read more News here

